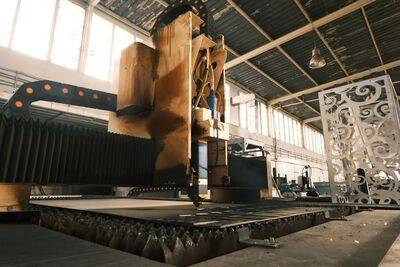

- OEE (Overall Equipment Effectiveness) expresses how effectively a production machine is used, as a percentage.
- The OEE formula is Availability times Performance times Quality.
- An OEE of 100% means only good parts, as fast as possible, with no downtime.
- 85% OEE is widely cited as world class, while many plants start around 60%.
- OEE is used in Total Productive Maintenance (TPM) to expose the six big losses on a production line.
OEE, or Overall Equipment Effectiveness, is the most common way to measure how productive a machine or production line really is. One percentage tells plant managers how much planned production time actually produces good parts.
A busy machine is not necessarily an effective one. It may stop often for breakdowns, run slower than its capacity or produce defects that must be scrapped. OEE combines all three problems into one measure.
The concept was introduced by Seiichi Nakajima as part of Total Productive Maintenance in Japan. Today OEE is used in automotive, food and beverage, pharmaceutical plants and small manufacturers alike.
Quick answer: OEE equals Availability x Performance x Quality. Availability is run time divided by planned production time, Performance is actual output against ideal speed, and Quality is good parts divided by total parts. For example, 90% availability, 95% performance and 98% quality give an OEE of 83.8%.What Is OEE?
OEE is the share of planned production time that is truly productive. 100% means the machine makes only good parts, at maximum speed, with no downtime at all, a level almost never reached in practice.
It has three components. Availability captures losses from stops, Performance captures losses from running slow, and Quality captures losses from defects and rework.
Because it is a product, one weak component drags the whole score down, which makes OEE good at pointing to the biggest source of loss.
The OEE Formula and Its Three Components
These are the standard formulas used on the shop floor.
| Component | Formula | Losses measured |
|---|---|---|
| Availability | Run time / Planned production time | Breakdowns, setups, changeovers |
| Performance | (Ideal cycle time x Total count) / Run time | Minor stops, reduced speed |
| Quality | Good count / Total count | Defects, rework, start-up rejects |
| OEE | Availability x Performance x Quality | All losses combined |
Run time is planned production time minus downtime. Ideal cycle time is the fastest time the machine can make one part.
Planned production time excludes scheduled stops such as breaks or holidays, so OEE only judges time when the machine should be running.
Worked OEE Example
Suppose a packaging machine runs an 8-hour shift, or 480 minutes, with a scheduled 30-minute break. Planned production time is 450 minutes.
The machine stops for 45 minutes due to a breakdown and a pack-size changeover. Run time is 405 minutes, so Availability = 405 / 450 = 90%.
The ideal rate is one pack every 0.5 minutes. In 405 minutes it makes 770 packs. Performance = (0.5 x 770) / 405 = 385 / 405 = 95.1%.
Of those 770 packs, 15 are defective, leaving 755 good ones. Quality = 755 / 770 = 98.1%.
OEE = 90% x 95.1% x 98.1% = 83.9%. That is close to world class, and the biggest loss is Availability, so cutting breakdowns and speeding up changeovers would help most.
What Is a Good OEE Score?
85% is often cited as world class for discrete manufacturing, a benchmark popularized in TPM literature that corresponds to roughly 90% availability, 95% performance and 99.9% quality.
Many plants that start measuring OEE land around 60%, while scores under 40% point to large, fixable losses. Benchmarks should be adjusted for industry and process.
The trend matters more than the absolute number. A steadily rising OEE shows improvement programs are working; a falling one is a signal to find the cause quickly.
The Six Big Losses and How to Raise OEE
TPM groups OEE losses into six big losses: breakdowns and setup or adjustments (availability), small stops and reduced speed (performance), and start-up rejects and production rejects (quality).
To raise availability, use scheduled preventive maintenance and SMED to shorten changeovers. For performance, log the short stops that often go unrecorded. For quality, trace root causes with tools such as fishbone diagrams.
Honest data is key. OEE calculated from estimates tends to run high and hide real problems. Small manufacturers can start with paper logs before moving to automated monitoring.
FAQ (Frequently Asked Questions)
Overall Equipment Effectiveness. OEE = Availability x Performance x Quality, expressed as a percentage. 85% is commonly cited as world class for discrete manufacturing. Availability measures time lost to stops, while performance measures how fast the machine runs compared with its ideal speed while operating. Yes. They can calculate it by hand by logging downtime, output and defects each day.1. What does OEE stand for?
2. What is the OEE formula?
3. What is world-class OEE?
4. What is the difference between availability and performance?
5. Can small businesses use OEE?
Conclusion
OEE gives an honest picture of machine productivity by combining downtime, speed and quality in one number. The formula is simple, but it is powerful for setting improvement priorities.
Start with one critical machine or line, record data consistently and focus on the lowest OEE component first.
- OEE = Availability x Performance x Quality.
- 85% OEE is considered world class for discrete manufacturing.
- The six big losses explain where OEE is lost.
- Fix the lowest component first.
- Small manufacturers can start with manual logs.